When students organize their scholarly papers, they need valid guidelines on how to write a results section of a research paper. In this case, a presented article offers critical insights, including a definition of a results section, its format, steps on how to write it, all the parts of a standard research paper and how this element differs from others, the information that should be included, and how to organize it correctly. A discussed guideline also teaches students specific differences between qualitative and quantitative research results sections, including examples and templates indicating how to present the main findings. In turn, an observed article provides recommendations with 8 dos and 8 don’ts of writing a results section, 20 tips that students should follow when organizing this part, and some examples of elements they can include in their research papers.
General Aspects
Students should read scholarly texts habitually to equip themselves with knowledge of specific requirements of high-standard papers. While these requirements are not similar for different types of papers, they have similar unique features. Basically, it is standard for writers of various types of essays to create a clear thesis statement that provides direction on a particular content and a well-organized outline that follows a correct essay structure and allows one to organize ideas logically. In turn, a presented guideline on how to write a results section provides insights into basic details students must address when writing this part, including all the other components of a research paper, the information essential to include, and its organization. Moreover, readers should view this article as an educational tool that empowers them to start writing a high-standard results section of a scientific research paper.
What Is a Results Section and Its Purpose
According to its definition, a results section of a research paper is a crucial component where study findings are presented in a clear, concise, and objective manner. Basically, the main purpose of writing a results section is to present the data collected and the outcomes of the analyses performed without any interpretation or bias (Carter et al., 2021), similar to how to write an essay on a poem with precision. This section typically includes tables, figures, and descriptive text that detail key results, allowing readers to see the evidence that supports research hypotheses or questions. By systematically organizing and reporting the data, this part allows readers to assess a particular validity of study conclusions and an overall reliability of the data, serving as a valid foundation for a discussion section, where an actual significance of the findings is interpreted while broader implications are considered (Wallwork, 2022). In terms of pages and words, the length of a results section depends on academic levels, scopes of research, and assignment requirements, while general writing guidelines are:
High School
- Length: 1-2 pages
- Word Count: 250-500 words
College
- Length: 2-3 pages
- Word Count: 500-750 words
University (Undergraduate)
- Length: 2-6 pages
- Word Count: 500-1,500 words
Master’s
- Length: 3-8 pages
- Word Count: 750-2,000 words
Ph.D.
- Length: 4-10+ pages
- Word Count: 1,000-2,500+ words

Format
| Section | Content | Details |
|---|---|---|
| Title | Brief title summarizing a particular content of a results section. | Should be concise and reflective of main findings. |
| Introduction | Briefly introduce a primary purpose of a results section. | Sets a specific context for study outcomes, often a few sentences summarizing research objectives. |
| Text Description | Descriptive summary of key findings. | Provides a narrative overview of outputs, highlighting the most important data points. |
| Tables and Figures | Visual representation of data (graphs, charts, tables, etc.). | Includes all relevant visual aids to illustrate study findings clearly in writing. |
| Statistical Analysis | Presentation of statistical results (mean, median, p-values, confidence intervals, etc.). | Detailed statistical outputs supporting the findings, including any relevant calculations or tests. |
| Data Interpretation | Objective presentation of data trends and patterns without interpretation. | Focuses on describing what the data shows without delving into implications or significance. |
| Summary of Findings | Concise summary highlighting the main findings. | Briefly recaps key findings, emphasizing the most significant data points in writing. |
| References to Figures | References to figures and tables within an entire paper’s text in accordance with APA, MLA, Chicago/Turabian, Harvard, or other formatting rules. | Inline references (e.g., “as shown in Figure 1”) to guide readers to relevant visual aids. |
Note: Some sections can be added, deleted, or combined with each other, and such a writing depends on a particular purpose of the findings and their representations. Basically, a standard writing format of a results section includes an introduction, presentation of descriptive statistics, visual aids, such as tables and figures, detailed narrative descriptions of key findings, and a summary of significant outputs. For example, to structure a results section in a research paper, scholars start with a brief introduction, followed by presenting their descriptive data, visual aids, and statistical analyses, then detailing key findings in a narrative form, and ending with a summary of the most significant outputs (Carter et al., 2021). In this case, people should write their results section in the past tense, as they are describing what was found in their research papers. Moreover, a results section presents raw data and findings of a study objectively, while an analysis section interprets these findings, discussing their implications, significance, and relevance to research questions (Ross & Willson, 2018). In turn, to start a results section in a research paper, people begin by briefly summarizing a specific purpose of an obtained data and providing an overview of this information being presented.
Steps on How to Write a Results Section
To write a results section in a research paper, people present their findings clearly and objectively, using descriptive words, tables, and figures to highlight key data, and include statistical analyses to support their outputs without interpreting its implications, which are reserved for a discussion part.
- Begin With an Overview: Start by providing a brief overview of a specific purpose and scope of a results section.
- Organize by Research Questions or Hypotheses: Structure study findings around study questions or hypotheses to maintain a clear focus of writing.
- Present Descriptive Statistics: Provide basic descriptive statistics, such as means, medians, and standard deviations, to summarize an entire data.
- Include Visual Aids: Use tables, figures, and charts to visually represent a presented data, making it easier to understand trends and patterns.
- Report Inferential Statistics: Present outcomes of any inferential statistical tests, including p-values, confidence intervals, and effect sizes.
- Be Objective: Write about the findings without interpreting or drawing conclusions to maintain objectivity.
- Highlight Key Findings: Emphasize the most important outcomes that directly address research questions or hypotheses.
- Reference Visual Aids: Ensure all tables and figures are properly numbered and referenced within an entire paper’s text.
- Ensure Clarity and Precision: Write clearly and precisely, avoiding any ambiguous language or unnecessary jargon.
- Summarize Study Results: Conclude with a concise summary of the main outcomes to provide a clear take-home message for readers.
Structure
A research paper is unique because it has sections with varying writing details about a specific study topic. For example, these sections include an introduction, literature review, research methodology, results, discussion, and conclusion (Carter et al., 2021). In this respect, a research paper is a comprehensive document that requires students’ total focus and dedication. Writers should use each part to provide information for readers to understand a real essence and significance of research papers. Therefore, to write a quality results section, one must know how it differs from other scientific papers and the information it must provide for readers. In turn, students should focus on a particular uniqueness of each element because it underscores its relevance in a research paper.
1️⃣ Introduction
An introduction is a first section of a research paper. As a title suggests, it aims to introduce a reader to a specific study problem under analysis. In this respect, there are critical details writers must provide in this part, including a research problem, a background of an overall investigation, a significance of a particular study, and a research question or hypothesis (Wallwork, 2022). Typically, scientific paper topics indicate study problems students may use for writing their scholarly papers. In turn, a background information addresses existing research and some gaps writers intend to explore using bridge sentences in their current papers. Moreover, a real significance of a specific study must explain why a current scientific work is essential, and research question(s) or hypothesis(es) address what writers intend to prove through their papers, either answering questions or validating null and alternative hypotheses (Carter et al., 2021). Thus, an introduction section of a research paper gives readers basic information about a writer’s scientific work. In turn, before an introduction, students can include an abstract or executive summary part, which means an overall summary of a research paper, but this writing is optional.
2️⃣ Review of an Existing Literature
A literature review is a second section of a research paper that examines existing evidence relating to a particular research paper problem. Additionally, it provides insights into thematic essay definition, helping writers structure their analysis more effectively. Depending on a chosen topic, writing this section is robust because one must demonstrate an in-depth understanding of a researched issue under review (Wallwork, 2022). More importantly, students must convince readers that they have investigated the evidence and found a gap by reviewing credible sources that justify their studies. The most significant detail that students should focus on when writing this part is to examine numerous reliable sources, including books, peer-reviewed academic articles, and reports by government agencies, to cite information and statistics relevant to a specific scientific problem or theoretical framework (Wallwork, 2022). Such information is essential in revealing a particular knowledge gap that justifies writing a current scientific paper.
3️⃣ Research Methodology
Research methodology is a third section of a research paper and focuses on unique methods that students use to conduct their research works. For example, scholars should understand that a scholarly paper takes many writing forms or designs that determine a specific approach to take to execute their tasks (Carter et al., 2021). The two main designs are qualitative and quantitative studies, while research methods include descriptive, experimental, case study, and observation. Therefore, when writing this section, students must know they intend to give readers a roadmap for conducting their scientific papers. Essential details include study participants, how to identify them and their total number, how to collect data, and the data analysis procedure(s) for outputs (Noyes et al., 2019). In turn, a research design is the most important writing detail to consider because it determines all the other components of a methodology part. Besides, this section tends to be longer than an introduction.
4️⃣ Results Section
A results section is a fourth part of a research paper and is where students outline the findings of their scientific works. Typically, this section is shorter than a previous one because its writing purpose is to provide readers with the outcomes of a research paper. Moreover, a results chapter of a dissertation includes a particular presentation of the findings, supported by descriptive statistics, tables, figures, and detailed narratives, without interpretation or discussion of their implications (Carter et al., 2021). As a title suggests, presented details in this part should point to specific findings only. Therefore, a particular issue that makes this element unique is that writers do not provide details that contextualize their work but only those that indicate its outcomes. The information in this section underscores a specific purpose of writing a research paper, including its ultimate objective. In turn, some examples of sentence starters for beginning a results section are:
- A particular analysis of the collected data revealed several key findings, including … .
- Discussed outcomes indicate a significant correlation between discussed variables, particularly in terms of … .
- The data presented in Table 1 shows a notable difference in outcomes, which can be attributed to … .
- Results from an entire study demonstrate a clear trend in behavior, suggesting … .
- Obtained outcomes suggest a strong relationship between independent and dependent variables, as evidenced by … .
- Upon a particular examination of the data, it was found that there were significant variations in … .
- Statistical analysis confirmed an initial hypothesis, showing that … .
- Experimental results present a marked improvement in performance when … .
- Current research underlines several interesting patterns, particularly in a context of … .
- The observed information highlights an actual importance of a particular control group, as shown by differences in … .
5️⃣ Discussion
A fifth section of a research paper is a discussion part, where authors link the results with the literature review. To write a results and discussion section, people present their findings clearly with supporting data and statistical analysis, interpret them, discuss their implications, and compare them to previous research in a discussion part (Snyder et al., 2019). Ideally, the information in this writing part acts as a summary of a research paper that requires one to confirm that the findings are relevant to addressing a defined knowledge gap that writers expressed in an introduction and literature review. Typically, people show this linkage by indicating whether the outcomes have answered study question(s) or validated hypothesis(es). Other essential writing details are possible limitations of a research paper.
6️⃣ Conclusion
A conclusion is a last section of a research paper. Basically, writing a concluding paragraph reiterates a research question, how study findings impact an entire practice, such as nursing or psychology, and a particular need for conducting further studies to address unresolved questions (Wallwork, 2022). This last writing part summarizes a research paper and affects a reader’s perspective on a specific study problem.
Providing the Right Information
A results section is about the findings of a research paper only. As such, students should not address anything that does not relate to the study question(s) or hypothesis(es). Typically, specific details in this section include data that writers present in tables, charts, graphs, or other visual figures as part of a paper’s text or separately on pages at the end of an entire document, such as acknowledgments or appendices (Carter et al., 2021). Another detail is a contextual analysis of a provided data to give readers a better understanding of how it relates to the study question(s) or hypothesis(es), expanding on the meaning of the information presented. In writing, further essential details in this part are data corresponding to the study question(s) or hypothesis(es) and secondary findings, including secondary outcomes and subgroup analyses (Carter et al., 2021). In turn, to deal with negative results, people present them objectively, discuss their potential causes, and highlight their significance or implications for future analysis. All these writing details make a results section unique because it is where readers need to understand a real essence of a scientific paper.
🔸 Study Results
While a results section’s primary purpose is to communicate specific findings of a research paper, students should know they cannot copy-paste raw information without writing a good explanation. For example, the information in this part must have a pattern demonstrating a logical organization of the findings (Ross & Willson, 2018). The best way to organize such findings is to use headings following a logical order of study questions or hypotheses and integrate data through charts, graphs, visuals, or tables thematically. In this respect, when writing a results section, auhtors must refer to an introduction part to ensure the information aligns with what they said. An important detail to note is that a graphical presentation of the outputs’ information is not sufficient. However, students must mention the data by writing statements that allow readers to understand how the results answer the research question(s) or validate or invalidate hypothesis(es) as a final outcome (Ross & Willson, 2018). Besides, figure and table captions are important because they provide essential context and explanations, allowing readers to understand a specific content and relevance of an observed visual information without referring back to a main paper’s text.
🔸 Figures, Charts, or Other Visuals
A logical presentation of data requires students to organize all data figures by numbering them and citing numbers in their paragraphs to link study findings to a research question or hypothesis. In writing, people need to choose a figure when they want to illustrate trends, patterns, or relationships in the data visually, and they opt for a table when they need to present precise numerical values or detailed information for comparison (Carter et al., 2021). A particular numbering format should follow a similar writing order in which an author mentions the data in a main paper’s text. One should also explain a methodology part that led to each figure. For example, students should capture the following writing details:
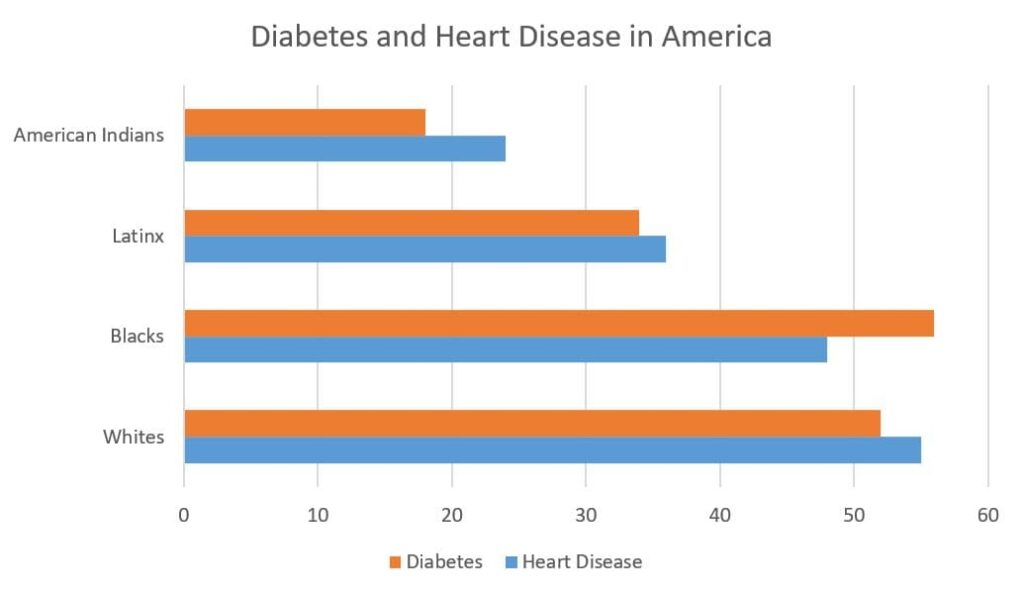
Figure 1: Racial/ethnic representation of health problems in the United States.
- Integrate the data into a main paper’s text by mentioning a specific percentage of Whites, Blacks, Latinx, and American Indians with diabetes and heart disease.
- Mention Figure 1 but not necessarily a title. For example, one can write: “Figure 1 shows a specific proportion of Whites and Blacks with heart disease is 55 percent and 48 percent, respectively.” With that statement, readers can look at this chart and read its title to make sense of a given sentence.
- Depending on a specific type of figure, writers can indicate a figure legend at the top. In an above example, it reads, “Diabetes and Heart Disease in America.”
- At the bottom of a figure (footnote), one should indicate a specific figure number followed by a caption that briefly describes this figure. In an above example, a given caption reads, “Racial/ethnic representation of health problems in the United States.”
- Writers must use labels to identify specific elements or features in a graph. In an above example, a horizontal axis uses percentages as labels indicating a specific proportion of Whites, Blacks, Latinx, and American Indians with diabetes and heart disease.
🔸 Tables
Like figures, tables capture data reflecting a results section of a research paper. However, they differ from charts in how they reflect the information. For example, their unique writing features include columns and rows, each with a subheading (Ross & Willson, 2018). In turn, an obtained data should be presented in figures and tables instead of directly in a main paper’s text when writing involves complex information, trends, or large datasets that are easier to understand visually or require precise comparison. The following writing example shows how students should use tables in a results section:
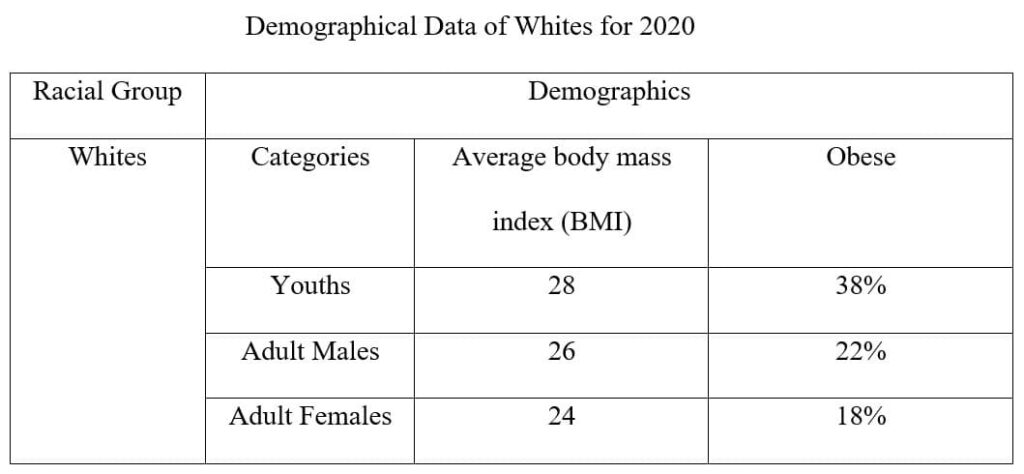
Table 1. Demographics of Whites in the United States for 2020 showing how obesity affects this population in the country. Young individuals are the most affected, with 38 percent presenting as obese, followed by adult females at 22 percent and then adult males at 18 percent. However, on average, the BMI index for all groups is below the obese level of 30.
- Writers should identify the data in a given table above by mentioning “Table 1” in a main paper’s text about specific demographics of Whites for 2020.
- Typically, most research papers use a footnote rather than a table title. While a title is necessary to enhance readers’ understanding, footnotes are more detailed in writing because they offer some analysis. In an above example, a particular footnote that follows a given caption below a table analyzes the information for a reader’s benefit.
- Typically, row headings capture groups, and column headings indicate demographical data. In an above example, a given row heading captures Whites as a racial group, while a provided column heading indicates group’s demographics. Writers should understand each row and each column should reflect one group and one demographical data, respectively.
- Sometimes, writers may have row subheadings to indicate group categories and column subheadings to capture variables for a better writing. In an above example, given row subheadings are youths, adult males, and adult females as group categories, while provided column subheadings indicate average BMI and obesity as demographic categories.
- Tables provide self-explanatory data to readers, and footnotes only attempt to make sense of it superficially. By looking at a specific table, people should comprehend the results without reading all the paper’s text.
Therefore, students should use figures and tables as focal points to communicate a clear and informative narrative about the findings of a research paper. In writing, authors should repeat every detail in a main paper’s text, although they must reference all data in a results section or other body paragraphs by pointing readers to “Table 1.”
Recommendations
When writing a great results section, students should know what to talk about or do and what not to talk about or not do. The things to do to demonstrate a high-standard outputs and those not to do can affect an overall section’s quality. From this perspective, students must habitually read research papers to familiarize themselves with 8 dos and 8 don’ts of writing a results section.
8 Dos
- Write in the past tense only. All study findings are what an author has established after conducting an actual study. A particular language that reflects this aspect is past tense. Common terminologies include ‘found,’ ‘established,’ and ‘confirmed.’ Using this language tells readers that an entire study has already happened and outcomes are clear, as such a text is represented through visuals, charts, graphs, figures, and tables.
- Write concisely. The findings require interpretation from statistical data to statistical analyses. Typically, this exercise involves complex language that may need to be clarified for readers. As such, students should write a results section clearly and concisely to avoid sending a wrong message to other scholars. As such, one must be clear about which finding relates to which study question or hypothesis.
- Referencing the study question(s) or hypothesis(es). A results section aims to answer the research question(s) or validate or invalidate the hypothesis(es). As such, students must refer to them (as applicable) when writing a results section. In turn, the best approach is to refer to them according to a particular order they appear in an introduction section for logical consistency.
- Begin with broad results. Typically, study findings of a research paper vary in how they answer the study question(s) or validate or invalidate the hypothesis(es). Some outputs are broad, requiring some comprehensive analysis, and others narrow, covering a brief mention. Students should begin writing with general results because they affect the scientific question(s) or hypothesis(es) more than narrow findings. However, they should mention narrow findings later in a main paper’s text because they are precise to a specific study question or hypothesis.
- Write the most critical findings from figures or tables. A primary purpose of figures and tables is to provide a broad picture of the results. However, only some details capture the most critical finding. In a table above, the most critical finding is a particular rate of obesity in the White community, specifically youths, adult males, and adult females. When referring to Table 1, a student should mention specific percentages of obesity prevalence in these groups as the most critical finding despite a given chart indicating other details, such as the BMI, which are central to this crucial output.
- Avoid background information and explanation of findings. Students should avoid explaining the results or providing any background information. At this part of a research paper, readers already understand a particular background of a given study because they have read introduction and literature review sections. Consequently, they expect an in-depth explanation of their outputs in a later discussion section.
- Do not capture raw data or intermediate calculations. Obtained findings in a results section should make sense to all readers. In writing, students should not provide raw data or indicate its intermediate calculations. A data analysis section that falls in a research methodology offers an unique opportunity for these writing exercises. Therefore, students should understand that this part should provide an answer to readers about the study question(s) or hypothesis(es), not leaving them with a boring task of analyzing the information to make a connection.
- Never ignore negative results. Authors of research papers probably have a biased interpretation of the results because they already have a preferred outcome. In writing, most students may be tempted to ignore negative results if they do not conform to their expectations or preferences. However, they must understand that a results section should reflect the findings of a research paper regardless of whether they are positive or negative in their eyes. This capture of the outputs makes any research paper scholarly and valid.
8 Don’ts
- Do not capture all data generated in a research paper. Writers need to understand that a primary purpose of writing a results section is to answer the study question(s) or validate or invalidate the hypothesis(es). Doing so does not require all the data, but what is relevant for this task. Moreover, research papers have limited length, and one cannot have room in a findings section to indicate all the data from the study experiment.
- Do not use text to describe everything. A main purpose of charts, figures, visuals, and tables is to capture and present data in a short summary. As such, they help writers to avoid explaining every piece of information and related detail because it may be complex and confusing to readers. Therefore, one should only describe or explain some things but use figures, visuals, and tables to present broad data.
- Do not repeat the data in figures and tables. When referring to figures, visuals, and tables in a main paper’s text, students should avoid repeating every piece of information but instead interpret it for readers. What is important in writing is the most critical data because it provides a clear and concise message about a research question or hypothesis. Therefore, students should interpret the data instead of repeating the same information as it is in the chart, visual, figure, or table. In an example of a table above, one should not repeat all the information but summarize writing by stating the group most affected by obesity and how.
- Do not jump around the data to discuss the findings. A logical presentation of data requires students to provide information that answers the research questions or hypotheses as they appear in an introduction. As such, one should avoid mentioning data relevant to one question when answering a different question. The same case should apply to hypotheses.
- Do not give long explanations. A results section should be short but clear and concise. In this respect, students should refrain from writing long explanations because they reduce a particular space for the most essential information: critical findings. The best writing approach to avoid long descriptions is to use figures, visuals, charts, and tables.
- Do not use meaningless numbers. While a results section aims to show data mostly in numbers for a quantitative study, students should avoid using every number they have if it is not meaningful to a research question or hypothesis. Therefore, after writing data analysis, one should decide on the most relevant and meaningful numbers to include in a results section.
- Do not cite other research papers. Since a main purpose of all outputs is to provide the findings of a research paper, one should avoid irrelevant details, including comparing the results to those of other scholarly paper. Students must understand that writing a discussion section gives them room to do so.
- Do not use the results of other authors. Writing any academic paper is designed for a specific purpose. In this case, students must do their own research papers and present unique findings section, including negative or positive ones. In writing, the findings of other authors can be used only for a comparison of the results.
Examples of a Results Section
The two primary research paper designs that scholars use for writing their scientific papers are qualitative and quantitative studies. Each design has a unique way of capturing the findings of a research paper (Noyes et al., 2019). The two examples below show how students should write a results section in qualitative and quantitative research papers. However, students must note a specific language and details, such as statistical data.
Example of a Qualitative Results Section
[Introductory context] A total of 98 respondents from different countries gave essential data by answering the survey questionnaire. The representation was as follows: 30 respondents were from the U.S. (30.6% of the total), 26 from China (26.5%), 22 from Russia (22.4%), and 20 from the United Kingdom (20.4%). […] [Important finding] According to the results, the most important cultural identifiers are language (w=0.3402), followed by ethnicity (w=0.2930) and religion (w=0.2279). Most respondents viewed gender as the most insignificant compared to the other three (w=0,1388) (Table 1). […] [Interesting Finding] An interesting finding is that the U.S. and the U.K. respondents considered sexual orientation as a determinant of a country’s cultural vibrancy, while those from China and Russia viewed it as an indicator of negative liberalism. All the respondents had a uniform consistency ratio (C.R.) of less than 0.08 (8%). [Another important finding] According to all the respondents, the three critical drivers of cultural vibrancy are technology (mean value of 4.88), education (4.60), contact with other cultures (4.40), and the media (4.30). Conversely, the factors that influence cultural assimilation the least, according to all the respondents, are cultural artifacts (2.88) and friendships (2.66) (Figure 1). […] [Summary of Key Findings] The findings indicate differences of opinion regarding some cultural topics and convergence of thought in others between countries from the respondents’ perspective. On differences, respondents from the U.S. and U.K. hold more liberal views than their Chinese and Russian counterparts. The point of convergence for all the respondents is the belief that culture is the most instrumental factor for interrogating the attitudes and behaviors of people.
Example of a Qualitative Results Section
[Introductory Context] The student data system for 2010 through 2020 was the source of the demographic data for the sample. The descriptive statistics include age, gender, grades, and course selection. Table 1 describes the cross-tabulation frequencies of the study sample. The mean age was 28.42 years, with a standard deviation of 8.22 years. The age range of the sample was from 18 to 50 years. [Relevant Finding] Overall, more students selected online than physical courses, with a uniform enrollment rate in online courses in both males and females; however, the proportion of males was high (62.7%) for online instruction than that of females (58.8%) as shown in Figures 1 and 2. […] [Significant Finding (including a significant test result)] A statistically significant difference in grades is reported between students enrolled in online classes and their counterparts in the traditional classroom setting. The mean and standard deviation for grades calculated by delivery type showed no significant difference between online and physical instruction. In contrast, those calculated by the instructor showed no significant difference in the mean grade. […] [Reference to Visual Data] Table 6 shows the impact of the delivery method and the instructor on students’ grades. […] The delivery method did not influence significant grade differences (F = 0.078, p = 0.780, df = 1, 811). The same case was reported for the instructor (F = 0.002, p = .967, df = 1, 811). The two factors had no significant interaction (F = 0.449, p = 0.503, df = 1, 811). [Relevant Finding] There is a statistically significant difference in student course retention between those taking online courses and their counterparts in physical classrooms (Supplementary Appendix Figure 1). Data were included for testing if a final grade was reported for a participant (Supplementary Appendix Figure 2). [Context to a Research Question or Hypothesis] The analysis of the contingency data was essential in confirming the hypothesis. Data organization indicates the row variable as course selection (online or physical classroom) and the column variable as retention in the course. [Explanation of a study Test] The chi-square testing (X2 = 2.524, p = .112, df = 1, 884) indicated no statistically significant difference between retention in online and physical classroom courses. [Significant Findings] The study includes a statistically significant difference in student retention between those who begin the program online and those who begin in the physical classroom. […] [Summary of Key Findings] Results from testing of H1 showed no significant difference between course grades for students enrolled in online courses and their counterparts in physical classroom courses. Chi-square testing of H2 indicated no significant difference in course retention between students taking online courses and those taking courses in the physical classroom environment. Chi-square testing of H3 indicated no significant difference in program retention between students who began the course online and those who began it in the physical classroom.
Enhance your academic performance with our top-notch, plagiarism-free papers.
Templates
Qualitative Results Template
- [Introductory Context]
- [Finding 1 – Important]
- [Finding 2 – Interesting]
- [Another Important Finding 3 that refers to a chart, figure, visual, or table]
- [Summary of key findings]
Quantitative Results Template
- [Introductory Context]
- [Finding 1 – Relevant]
- [Finding 2 – Significant – with reference to a test result]
- [Reference to a chart, figure, visual, or table]
- [Finding 3 – Relevant]
- [Context to a Research Question or Hypothesis]
- [Explanation of a Study Test]
- [Finding 3 – Significant]
- [Summary of key findings]
Looking at the two templates, it is evident that crucial writing details appear in all but some only in quantitative research. In both templates, students should introduce this section by stating some facts, such as a study sample, and enumerate the results, using charts, figures, visuals, or tables as necessary. However, only in a quantitative study, one should mention tests and their outcomes.
Qualitative vs. Quantitative Results Sections
There are areas of similarity and difference between the results sections of qualitative and quantitative research studies. The main similarities are that both types capture statistical data or reports and do not interpret the meanings of data with long explanations. However, there are many differences in presenting the content. Firstly, a qualitative results section emphasizes non-numerical, descriptive data, focusing on themes and ideas (Cristancho et al., 2021). In contrast, a quantitative results section highlights measurable (or quantifiable) numerical data relevant to interpreting trends, making predictions, running experiments, or testing hypotheses. Another difference is that a qualitative results section adopts descriptive and interpretive approaches to make sense of the collected data. On the other hand, a quantitative results section adopts numbers-based strategies, including statistics, calculations, and data measurements, to make sense of the collected information.
Research Questions and Hypotheses
When writing a results section, students must focus on the research question(s) or hypothesis(es) they stated in an introduction part because they underscore a paper’s importance or purpose. Regarding research questions, the data presented in this part must refer to specific questions as they appear in an introduction paragraph, giving outcomes that reflect answers to these queries. Concerning hypotheses, students should ensure a results section confirms or rejects them. In other words, a good results section should help readers to understand a specific scientific problem by answering the study question(s) or validating or invalidating the hypothesis(es). Therefore, when writing a results section, students should know they are answering a specific research question or confirming a study hypothesis. This determination is crucial because it must reflect proper language, concepts, and terms used in a main paper’s text.
Tips
Writing a high-standard results section of a research paper is a technical undertaking that requires students to grasp helpful insight. For example, the most common mistake beginner writers make in a results section is including interpretations and discussions of the data rather than strictly presenting study findings objectively (Carter et al., 2021). In writing, some of the useful tips include always using simple and clear language, avoiding irrelevant expressions, discussing the findings objectively without overinterpretation, using sub-sections if there are more study questions or hypotheses, including negative outputs even if they do not support a specific study hypothesis, providing visuals charts, figures, visuals, and tables to document the results, and mentioning the tests and their outcomes for a quantitative study.
10 things to do when writing a results section include:
- briefly and precisely summarizing the results at the beginning of the section;
- using visual illustrations, like charts, figures, and tables;
- arranging the outputs logically;
- linking the data to the research question(s) or hypothesis(es);
- following clear, simple, and concise language;
- being objective in writing;
- avoiding long explanations;
- including statistical analyses to make the data sensible to readers;
- providing the correct information for the right study question or hypothesis;
- presenting paragraphs that respond to different scientific questions or hypotheses.
10 things not to do when writing a results section include:
- using raw data;
- duplicating similar information by repeating the data in the visual illustrations within a paper’s main text;
- including repetitive background information;
- constantly referring to study methods while writing;
- overlooking negative findings that do not support biases or invalid claims;
- providing charts, figures, visuals, or tables excessively;
- explaining the outputs comprehensively;
- presenting a findings section of other research papers as writers’ study outcomes;
- failing to give graphs, figures, and tables a number;
- not mentioning a specific chart, figure, visual, or table number within a main paper’s text.
What to Include
| Element | Description |
|---|---|
| Descriptive Statistics | Present basic measures, such as means, medians, standard deviations, and ranges, to summarize the data for writing. |
| Visual Aids | Include tables, figures, charts, and graphs to represent information visually and clearly, making it easier to identify trends and patterns. |
| Comparison of Results | Compare the findings with initial hypotheses or expected outcomes. |
| Data Trends and Patterns | Describe any noticeable trends and patterns in the data, such as increases, decreases, or correlations. |
| Unexpected Findings | Note any unexpected outputs or anomalies observed during a particular study. |
| Subgroup Analysis | Write about the findings for different subgroups within the data to show variations and specific trends. |
| Statistical Tests | Include outcomes of statistical analyses, including p-values, confidence intervals, and effect sizes. |
| Quantitative Data | Provide numerical data that provides measurable evidence, such as percentages, frequencies, and ratios. |
| Qualitative Data | Cover descriptive data that provides insights into patterns and themes observed in the research. |
| Error Analysis | Write about information on a particular accuracy of an obtained data, including error margins and sources of potential error. |
Summing Up
Writing a results section of a research paper is crucial for presenting study outcomes in a clear and concise manner. Basically, this section should start with a brief introduction to a corresponding purpose of study findings and a methodology used to obtain the data. Then, presenting obtained outcomes should be done using a descriptive text and supported by tables, figures, and charts for clarity. Moreover, statistical analyses should be reported clearly, indicating significance levels and confidence intervals where appropriate. In writing, such a part of a research paper should focus solely on presenting information without interpretation, which is reserved for a discussion paragraph. Besides, proper organization and logical flow are essential, and visual aids should be numbered and referenced in an entire paper’s text. Finally, this writing approach ensures a results section is easily understandable and directly addresses research questions or hypotheses posed in a given study. In turn, some rules to remember include:
- Start writing a results section by restating a specific purpose of a research paper.
- Use the past tense to describe the paper’s findings.
- Avoid vague language.
- Provide a clear, coherent, and logical explanation of all outputs without bias.
- Include information that answers the study question(s) or validates or invalidates the hypothesis(es).
- Use useful and quality visual illustrations, like charts, figures, and tables.
- Present details about data analysis and interpretation and mention any statistical tests and their outcomes.
- Report statistically insignificant findings to give a research paper credibility.
- Conclude with writing a short paragraph that summarizes key findings.
- Proofread, revise, and edit a results section to eliminate any mistakes.
References
Carter, S., Guerin, C., & Aitchison, C. (2021). Doctoral writing: Practices, processes and pleasures. Springer.
Cristancho, S., Watling, C., & Lingard, L. (2021). Three principles for writing an effective qualitative results section. Focus on Health Professional Education: A Multi-Professional Journal, 22(3), 110–124. https://doi.org/10.11157/fohpe.v22i3.556
Noyes, J., Booth, A., Moore, G., Flemming, K., Tunçalp, Ö., & Shakibazadeh, E. (2019). Synthesising quantitative and qualitative evidence to inform guidelines on complex interventions: Clarifying the purposes, designs and outlining some methods. BMJ Global Health, 4(1), 1–14. https://doi.org/10.1136/bmjgh-2018-000893
Ross, A., & Willson, V. L. (2018). Basic and advanced statistical tests: Writing results sections and creating tables and figures. Sense Publishers.
Snyder, N., Foltz, C., Lendner, M., & Vaccaro, A. R. (2019). How to write an effective results section. Clinical Spine Surgery: A Spine Publication, 32(7), 295–296. https://doi.org/10.1097/bsd.0000000000000845
Wallwork, A. (2022). Writing an academic paper in English: Intermediate level. Springer International Publishing Springer.